Setup
Features
API
Response times monitoring
On each Uptime Check 1Pilot stores response time of the website and displays it on a graph available on the "Response Time" tab of the details page of your website. There you can see the evolution of the response time on 4 graphs:
- last 4 hours - evolution in real time
- 48 hours - follow the time evolution with an hourly summary
- 30 days - follow the time evolution with a daily summary
- 12 months - follow the evolution with a monthly summary
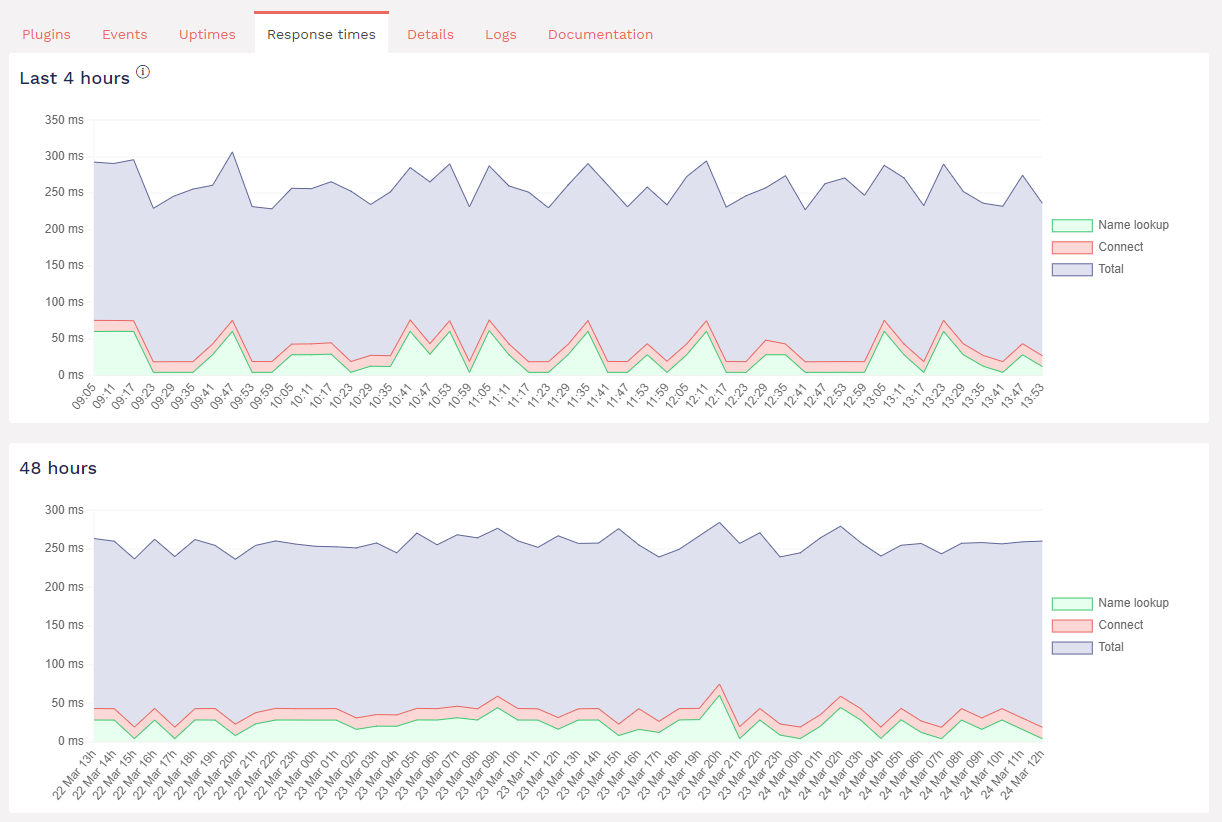
These graphs should help you diagnose loading issue on your websites (and help answer the “since when is this website so slow?” question).